A Return to Better Funding for Pensions in 2006
Pension plan funding has been up and down during the last six years. In many firms, formerly fully funded defined benefit plans became significantly underfunded early in the decade, as the stock market plummeted and falling interest rates pushed up present-value measures of liabilities. These trends are cyclical and, fortunately, the trend for 2006 is up. To track the latest developments, Watson Wyatt projected 2006 year-end aggregate financial status for firms that have made the FORTUNE 1000 list during the last six years.1
Watson Wyatt has been tracking plan funding levels for several years. Between 2002 and 2005, aggregate funding status for large pension plans increased from 82 percent to 92 percent.2 For 2006, pension funding at these companies will continue to improve, reaching a projected aggregate funding level of roughly 100 percent for the first time since 2001 (Figure 1).3
Figure 1 | FORTUNE 1000 Companies' Pension Assets Versus Liabilities and Aggregate Funding Status, 2000 - Projected 2006
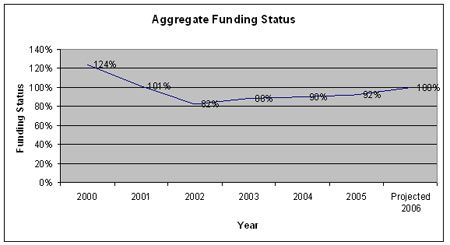
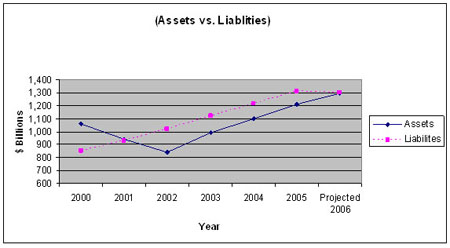
Source: Watson Wyatt Worldwide
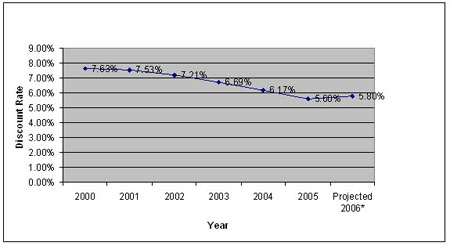
Higher funding levels are mostly a result of higher discount rates coupled with a year of strong market returns. After four years of widespread underfunding, these advantageous financial conditions combined with ample plan contributions have restored many plans to full funding.
Table 1 depicts projected aggregate funding ratios and funding components for fiscal year 2006.
Table 1 | Projected Changes in Pension Benefit Obligations and Assets During 2006 for FORTUNE 1000 Sponsors ($ billions)
|
Projected Benefit Obligation
2005 |
1,313 |
Market Value of Assets 2005 |
1,207 |
| Service cost |
+33 |
Employer contributions |
+ 50 |
|
Interest
cost |
+71 |
Return on assets |
+
119 |
|
Actuarial
gain |
-37 |
||
|
Benefits
paid |
-83 |
Benefits paid |
-83 |
| Projected Benefit Obligation 2006 |
1,297 |
Market Value of Assets 2006 |
1,293 |
|
Memo: Funding
status
2005 Funding status 2006 |
0.919 0.997 | ||
|---|---|---|---|
Source: Watson Wyatt Worldwide
Lower Pension Liabilities
|
|
Plan Contributions |
Service Cost |
Ratio |
| 2006 (projected) |
50.2 |
32.8 |
1.53 |
|
2005 |
46.4 |
30.2 |
1.53 |
| 2004 |
44.3 |
27.8 |
1.59 |
|
2003 |
63.1 |
25.1 |
2.51 |
|
2002 |
37.9 |
23.2 |
1.63 |
|
2001 |
11.2 |
21.3 |
0.52 |
| 2000 |
13.7 |
20.3 |
0.67 |
|
Memo: Expected
contributions reported in the footnotes |
$27.3
billion | ||
|---|---|---|---|
Source: Watson Wyatt Worldwide